
 たぬ
たぬこんにちは、グロースハッカーの たぬ ( @tanuhack )です。
お世辞にもイケてるとは言えない matplotlib の描画スタイルですが、
この記事で紹介するたったの 1行 プログラムを追加するだけの方法で、作成した図に モダン(今風) なデザインを適用することができます。
視覚化を意識した図を作ることには向いていませんが、 サクッと良い感じのデザインにしたい ときにオススメです。
このブログで紹介する matplotlib と seaborn の記事は、以下のモジュールを読み込んで進めるものとします。
import matplotlib as mpl
import matplotlib.pyplot as plt
import seaborn as sns| バージョン | 確認コマンド | |
|---|---|---|
| Python | 3.8.5 | % python -V |
| matplotlib | 3.3.2 | mpl.__version__ |
| seaborn | 0.11.1 | sns.__version__ |
mpl.style.use メソッドを使用する
matplotlib.style.use メソッドを使用すると、あらかじめ matplotlib に用意されているスタイルシートを着せ替え人形のような形で適用させることができます。
https://matplotlib.org/stable/api/style_api.html#matplotlib.style.use
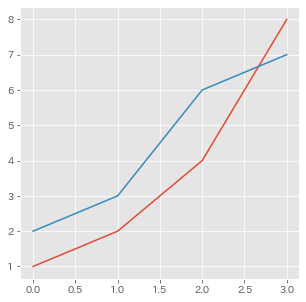
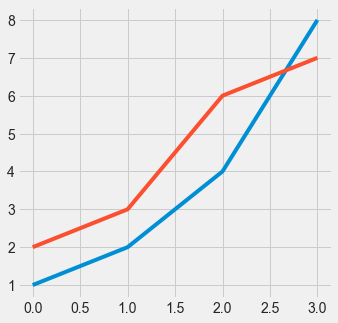
mpl.style.use('{ スタイルシート名 }')図を作成する前に、matplotlib.style.use メソッドを読み込むことで、描画スタイルが図に適用されます。
mpl.style.use('ggplot')
fig, ax = plt.subplots(figsize=(5, 5))
ax.plot([1, 2, 4, 8])
ax.plot([2, 3, 6, 7])
スタイルシート一覧
関数にセットできるスタイルシートの値は、mpl.style.available 属性で確認できます。
print(mpl.style.available)
# ['Solarize_Light2',
#  '_classic_test_patch',
#  'bmh',
#  'classic',
#  'dark_background',
#  'fast',
#  'fivethirtyeight',
#  'ggplot',
#  'grayscale',
#  'seaborn',
#  'seaborn-bright',
#  'seaborn-colorblind',
#  'seaborn-dark',
#  'seaborn-dark-palette',
#  'seaborn-darkgrid',
#  'seaborn-deep',
#  'seaborn-muted',
#  'seaborn-notebook',
#  'seaborn-paper',
#  'seaborn-pastel',
#  'seaborn-poster',
#  'seaborn-talk',
#  'seaborn-ticks',
#  'seaborn-white',
#  'seaborn-whitegrid',
# 'tableau-colorblind10']個人的によく使うのは、ggplot、seaborn-darkgrid、fivethirtyeightあたりです。
| スタイルシート名 | 説明 |
|---|---|
ggplot | R ユーザーおなじみのグラフ描画のパッケージ風スタイル。デザインは一番好みです。 |
seaborn-darkgrid | 次章で紹介するsns.setメソッドで読み込まれるスタイル。EDA にオススメ。 |
fivethirtyeight | FiveThirtyEight 風のスタイル。シンプルさと力強さが気持ちいいです。 |
他のスタイルがどのように適用されるのか確認したい場合は、公式のスタイルシートリファレンスを確認してください。
https://matplotlib.org/stable/gallery/style_sheets/style_sheets_reference.html
sns.set メソッドを使用する
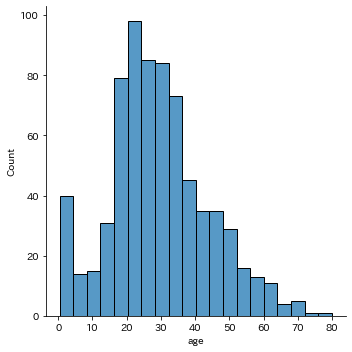
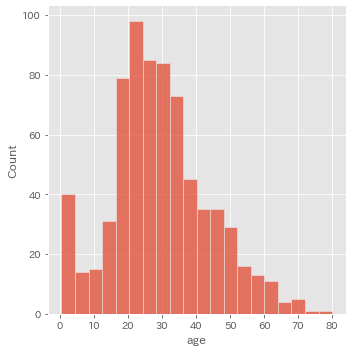
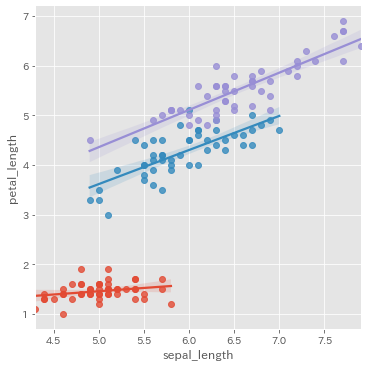
seaborn.setメソッドを使用すると、EDA(探索的データ解析)にオススメな seaborn-darkgrid スタイルを適用することができます。
setメソッドはset_themeメソッドのエイリアス(別名)です。
https://seaborn.pydata.org/generated/seaborn.set_theme.html
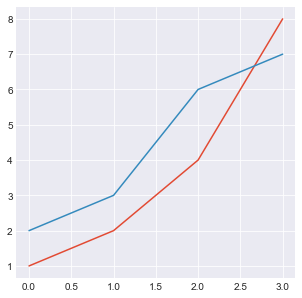
sns.set()こちらもmatplotlib.style.use メソッドと同様、図を作成する前に読み込むことで、描画スタイルが図に適用されます。
sns.set()
fig, ax = plt.subplots(figsize=(5, 5))
ax.plot([1, 2, 4, 8])
ax.plot([2, 3, 6, 7])
デフォルトのスタイルに戻す
mpl.style.useやsns.setでスタイルシートを適用させたものをデフォルトのスタイルに戻すには、mpl.style.use('default')コマンドを実行します。
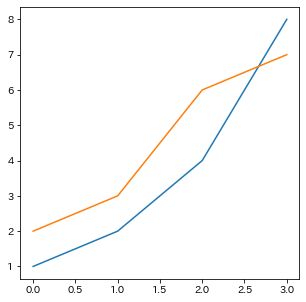
- mpl.style.use('ggplot')
+ mpl.style.use('default')
  fig, ax = plt.subplots(figsize=(5, 5))
  ax.plot([1, 2, 4, 8])
  ax.plot([2, 3, 6, 7])
コメント